`raw_cgm` contains fully synthetic continuous glucose monitoring (CGM) measurements generated at a 5‑minute sampling rate over a 14‑day period for two simulated participants (`P01` and `P02`). The dataset is designed to reflect realistic day‑to‑day variability in glucose‑like numerical signals, including higher‑value excursions, lower‑value dips, circadian changes, meal‑related peaks, overnight reductions, and stochastic variability.
Format
A tibble with three columns:
- id
Character ID for the participant (
"P01"or"P02").- cgm_timestamp
POSIXct timestamp in UTC at nominal 5‑minute cadence, with implicit gaps due to simulated missingness.
- glucose
Numeric synthetic glucose‑like value in mmol/L.
Details
Participants
"P01"— CGM begins at"2026‑01‑01 07:17:00"(UTC)"P02"— CGM begins at"2026‑01‑02 15:52:00"(UTC)
Each participant is simulated for exactly **14 days** with a **5‑minute** sampling interval (288 points per day before missingness).
Generation script
This dataset is produced reproducibly using:
data-raw/simulate_raw_cgm.RExamples
data(raw_cgm, package = "hypometrics")
# Inspect structure
dplyr::glimpse(raw_cgm)
#> Rows: 7,056
#> Columns: 3
#> $ id <chr> "P01", "P01", "P01", "P01", "P01", "P01", "P01", "P01", …
#> $ cgm_timestamp <dttm> 2026-01-01 07:22:00, 2026-01-01 07:27:00, 2026-01-01 07…
#> $ glucose <dbl> 6.46, 6.00, 7.06, 7.63, 6.99, 6.81, 6.26, 6.69, 6.74, 6.…
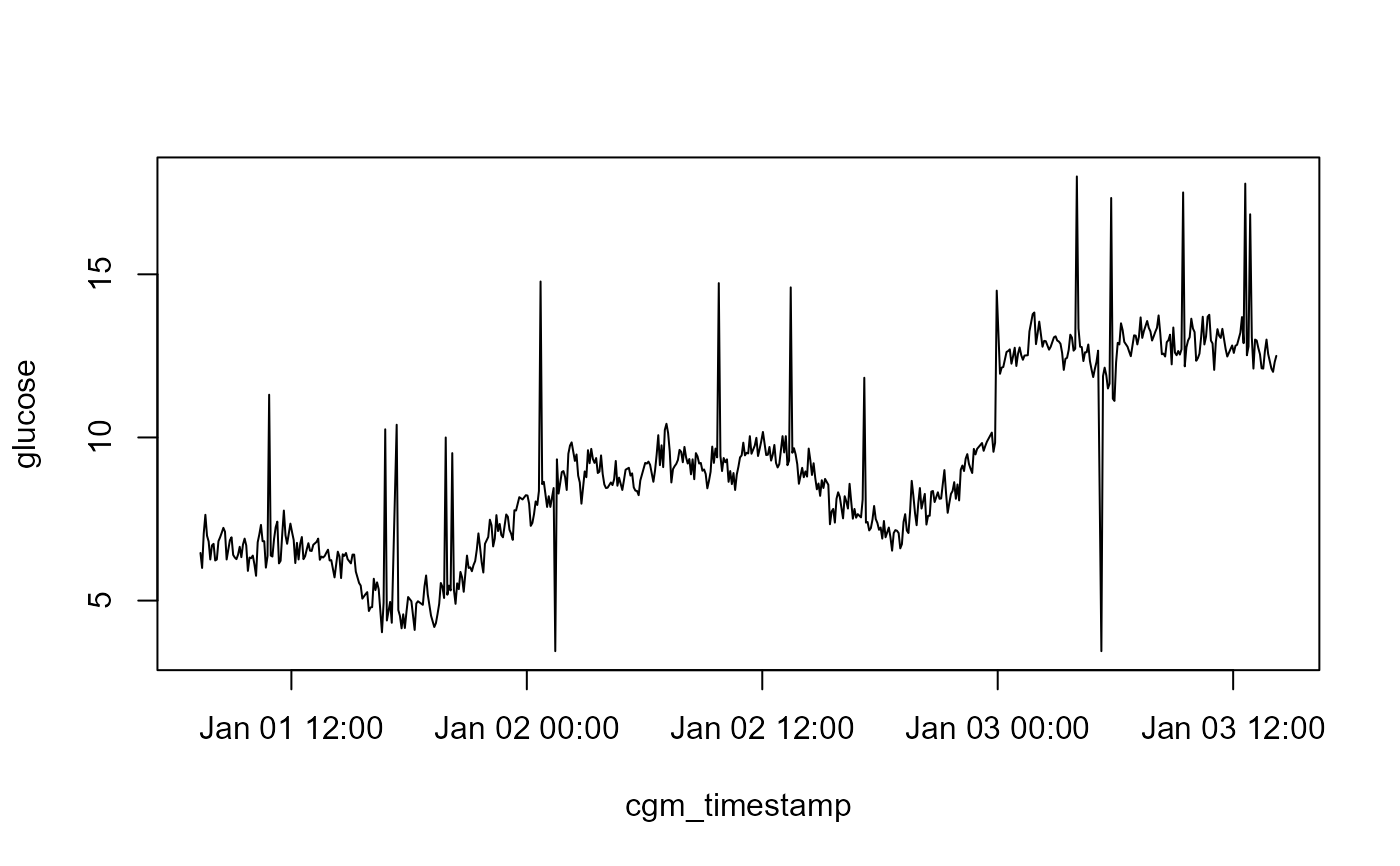
# Example: plot first 48 hours of P01
raw_cgm %>%
dplyr::filter(id == "P01") %>%
dplyr::arrange(cgm_timestamp) %>%
dplyr::slice(1:600) %>%
with(plot(cgm_timestamp, glucose, type = "l"))